Desenhar as coordenadas no mapa
eu estou tentando desenhar o meu coordenadas usando R. eu já tentei seguir diferentes post (R: Enredo agrupados coordenadas no mapa ; Plotagem de coordenadas de vários pontos no mapa do google em R), mas eu não estou tendo muito sucesso com meus dados.
estou a tentar alcançar um mapa plano do mundo com a minha coordenada gps como pontos coloridos (cada área uma cor específica):
area         lat    long
Agullhas    -38,31  40,96
Polar       -57,59  76,51
Tasmanian   -39,47  108,93

library(RgoogleMaps)
lat <- c(-38.31, -35.50) #define our map's ylim
lon <- c(40.96,37.50) #define our map's xlim
center = c(mean(lat), mean(lon))  #tell what point to center on
zoom <- 2 #zoom: 1 = furthest out (entire globe), larger numbers = closer in
terrmap <- GetMap(center=center, zoom=zoom, maptype= "satallite", destfile = "satallite.png")
a outra opção que tentei foi:
library(maps)
library(mapdata)
library(maptools)
map(database= "world", ylim=c(-38.31, -35.5), xlim=c(40.96, 37.5), col="grey80", fill=TRUE, projection="gilbert", orientation= c(90,0,225))
lon <- c(-38.31, -35.5)  #fake longitude vector
lat <- c(40.96, 37.5)  #fake latitude vector
coord <- mapproject(lon, lat, proj="gilbert", orientation=c(90, 0, 225))  #convert points to projected lat/long
points(coord, pch=20, cex=1.2, col="red")  #plot converted points
3 answers
Em alternativa a RgoogleMaps, também pode utilizar a combinação ggplot2 com ggmap.
Com este código:
# loading the required packages
library(ggplot2)
library(ggmap)

# creating a sample data.frame with your lat/lon points
lon <- c(-38.31,-35.5)
lat <- c(40.96, 37.5)
df <- as.data.frame(cbind(lon,lat))

# getting the map
mapgilbert <- get_map(location = c(lon = mean(df$lon), lat = mean(df$lat)), zoom = 4,
                      maptype = "satellite", scale = 2)

# plotting the map with some points on it
ggmap(mapgilbert) +
  geom_point(data = df, aes(x = lon, y = lat, fill = "red", alpha = 0.8), size = 5, shape = 21) +
  guides(fill=FALSE, alpha=FALSE, size=FALSE)
Uma outra alternativa, é o pacote plotGoogleMaps que permite desenhar num navegador, permitindo ampliar e reduzir, etc. Você pode então fazer uma imagem de sua imagem para salvá-la (embora lembre-se que o google maps é legalmente suposto ser usado para a internet).
 library("plotGoogleMaps")
 lat <- c(-38.31, -35.50) #define our map's ylim
 lon <- c(40.96,37.50) #define our map's xlim

 # make your coordinates a data frame
 coords <- as.data.frame(cbind(lon=lon,lat=lat))

 # make it a spatial object by defining its coordinates in a reference system
 coordinates(coords) <- ~lat+lon

 # you also need a reference system, the following should be a fine default
 proj4string(coords) <- CRS("+init=epsg:4326")
 # Note: it is a short for:
 CRS("+init=epsg:4326")
 > CRS arguments:
 >  +init=epsg:4326 +proj=longlat +datum=WGS84 +no_defs +ellps=WGS84 +towgs84=0,0,0

 # then just plot
 a <- plotGoogleMaps(coords)
 # here `a <-` avoids that you get flooded by the html version of what you plot
E tu recebes :

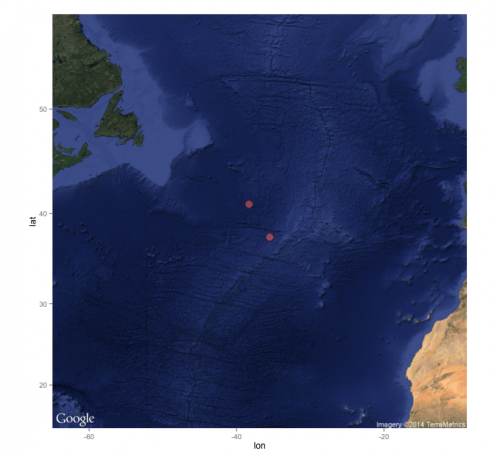
Aqui está uma solução usando apenas Rgooglemaps, como solicitado pelo Usuário.
# get map (from askers OP, except changed map type = "Satallite" to type = "Satellite")
library(RgoogleMaps)
lat <- c(-38.31, -35.50) #define our map's ylim
lon <- c(40.96,37.50) #define our map's xlim
center = c(mean(lat), mean(lon))  #tell what point to center on
zoom <- 2 #zoom: 1 = furthest out (entire globe), larger numbers = closer in
terrmap <- GetMap(center=center, zoom=zoom, type= "satellite", destfile = "satellite.png")

# plot points and save image
lat <- c(-38.31, -57.59, -39.47)
lon <- c(40.96, 76.51, 108.93)
png('map.png')
PlotOnStaticMap(terrmap, lat = lat, lon = lon, pch = 20, col = c('red', 'blue', 'green'))
dev.off()
